Packets tab
The Packets tab displays all of the packets for both sides of a flow.
Packets are displayed as horizontal bars in client/server colors, with arrow and position cues to show in which direction each packet was sent. In the toolbar, the Ticks drop-down list lets you display time as a vertical separation between packets. Sliced packets appear with their sliced portion dimmed.
For a complete list and description of the columns available in the Packets tab, see Flow Visualizer Packets tab columns.
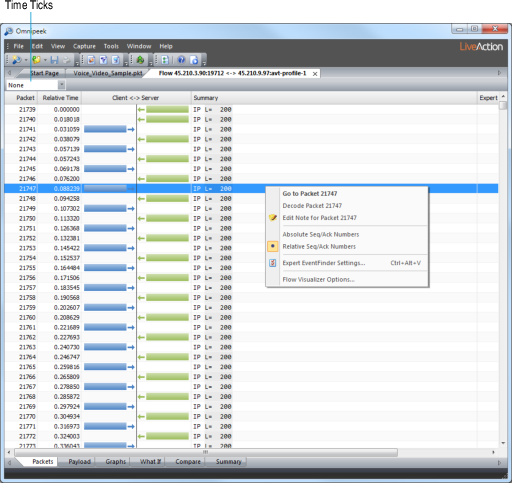
Time ticks
To create a vertical time axis within the Packets tab, choose a value other than None in the Time Ticks drop-down list. In the Client <-> Server column, the inserted tick mark rows show the delta time from the previous packet. Low-latency packets will be tightly clustered, while slow-responding, high-latency packets will be separated by a larger number of tick-mark rows.
NOTE: After 9 tick-mark rows, the a final ellipsis (…) and the actual delta time is inserted.
Relative SEQ/ACK numbers
The Packets tab displays SEQ and ACK numbers in the Summary column. You can use the context menu to toggle between a shorter and a longer version of these numbers.
The actual sequence (SEQ) and acknowledgement (ACK) numbers are typically 9-digit numbers from a large initial random value. For most purposes, only their sequence is significant.
Right-click and enable in the context menu to shorten the numbers while preserving their sequence (display shows SEQ and ACK numbers starting at zero, subtracting the lowest observed number from each subsequent number).
Disable to display the actual SEQ/ACK number values found in the packets.
NOTE: The Sequence, TCP Trace, and TCP Window graphs in the Graphs tab display sequence numbers as a vertical axis. You can also use the context menu to toggle between relative and absolute values for SEQ/ACK numbers in these graphs.
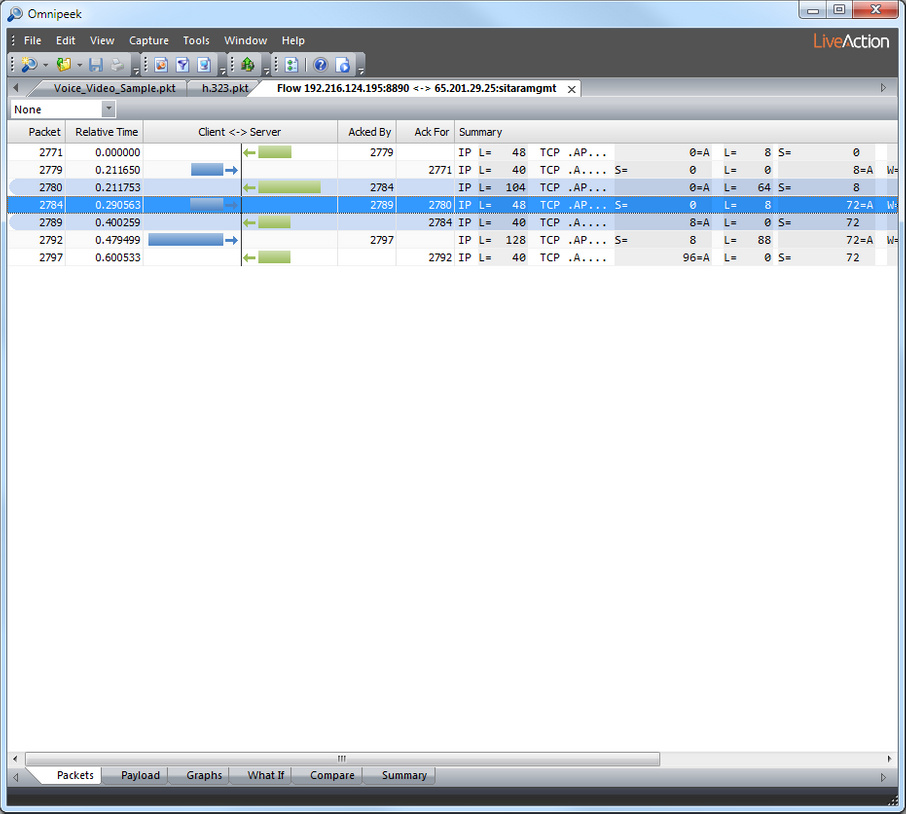
Highlighting SEQ/ACK relationships
As you select different rows in the Packets tab list, a blue highlight appears to help you follow SEQ/ACK relationships. The packets acknowledged by the selected packet are highlighted light blue, above the selected packet. The first packet that acknowledges the selected packet is also highlighted in light blue, below the selected packet.
You can also see this ACK relationship by showing the Acked By and Ack For columns, as in the following figure.
Flow Visualizer options dialog
The Flow Visualizer Options dialog lets you set display options for the Packets tab.
To set Flow Visualizer display options, follow these steps:
1. Right-click in the Packets tab and choose .
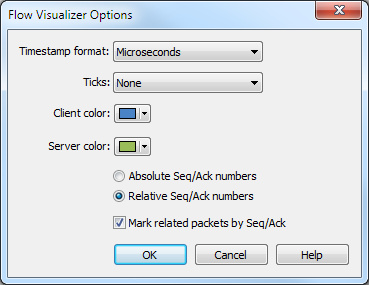
2. Fill in the parameters of your choice.
NOTE: Click in the dialog to learn about the available options and settings.
3. Click to accept your changes.